The dashboard presents a quick, high-level picture of your JD Edwards EnterpriseOne configuration.
Recent Clarity Alerts
You can review the most recent synthetic monitoring and log parse alerts right on the Clarity Dashboard.
JDE Network Map
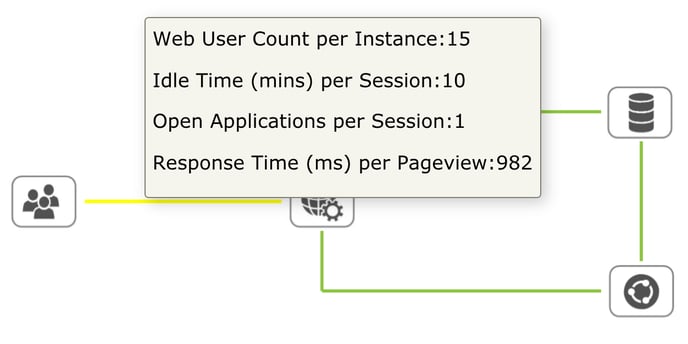
Clarity was built to alert CNCs, but to help them zero in on issues quicker too. The JDE Network Map is a good place to start. It outlines the basic path of communication between users and the various servers involved in JD Edwards performance.
- Watch for yellow or red lines indicating an issue between users and/or servers.
- Hover on a line for details. Or, click on an icon to dig deeper into metric details.