The dashboard presents a quick, high-level picture of your JD Edwards EnterpriseOne configuration.
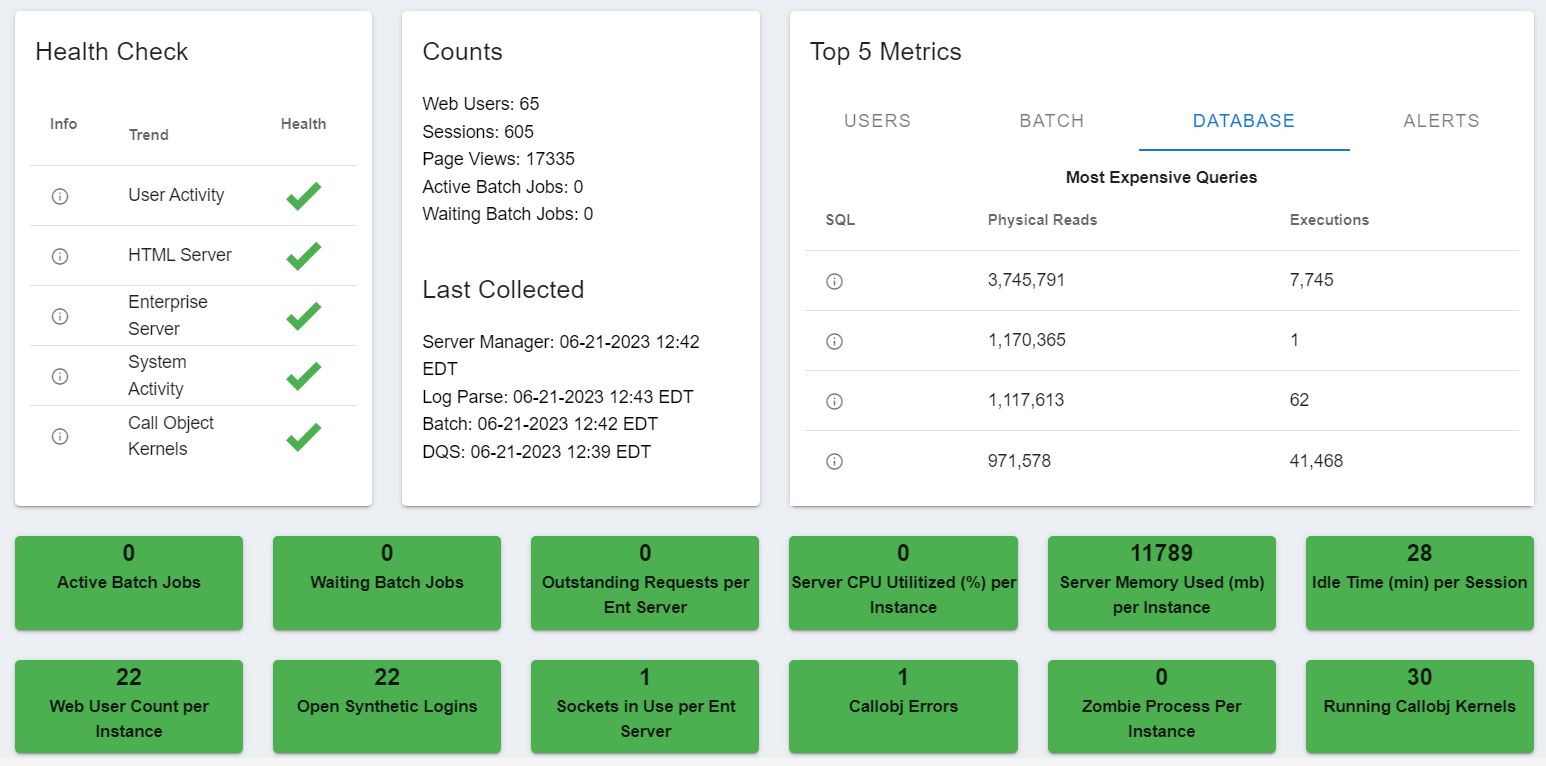
Health Check
Key application parameters that help you narrow down the source of an issue at a glance. Watch for red exclamation points then hover over the parameter click on the information icon for details.
Counts
Top metrics from several Clarity pages, such as total Web Users, total number of active application sessions, page views, active batch jobs and waiting batch jobs.
Last Collection
The most recent collection times for monitors
Top 5 Tables
More key information at a glance, top 5 users, batch jobs, expensive DB queries, and latest alerts
Company Threshold Cards
Color coded cards based on customer baseline metrics.
Thresholds are maximum limits—defined on a per metric basis—that apply to metrics within your organization. They are the foundation for alerts (green/yellow/red) throughout Clarity.
- Green means a metric is well below the threshold.
- Yellow means a metric is within 75% of the threshold.
- Red means a metric is greater than or equal to the threshold.
Company thresholds are set by default in Clarity based on the recommendation of our experienced CNC team.